London Areas Dominate England's Worst Traffic Hotspots
A comprehensive new analysis has identified the English local authorities where motorists endure the longest traffic delays, with London boroughs overwhelmingly dominating the top ten positions. The research, conducted by The Bike Insurer, examined 2024 data from the Department for Transport across 129 local authorities in England. The study calculated the average amount of time driver journeys are delayed over a standard 10-mile distance to establish a definitive congestion ranking.
The Most Congested Local Authorities in England
The City of London emerged as the local authority where drivers spend the most time stuck in traffic. Based on a typical 10-mile journey within this area, motorists can expect to experience a substantial 44 minutes and 22 seconds of delays on average, in addition to their normal travel time. This equates to an average delay of 4 minutes and 26 seconds per mile, highlighting the severe congestion challenges in the financial heart of the capital.
Camden ranked as the second most congested local authority for drivers. For a 10-mile journey through this bustling borough, motorists face an additional 42 minutes and 2 seconds of delays on average beyond their usual travel duration. This translates to an average delay of 4 minutes and 12 seconds per mile, cementing Camden's position as one of London's most traffic-heavy areas.

Westminster placed third among local authorities with the highest traffic delays. Drivers navigating a 10-mile route through this central London district can anticipate an average of 34 minutes and 32 seconds in additional travel time. Per mile, this works out to approximately 3 minutes and 27 seconds of delays, reflecting the area's dense traffic flow and frequent congestion points.
Islington ranked fourth for the longest driving delays in England. A typical 10-mile journey here sees an average of 34 minutes of extra time spent in traffic, equating to a per-mile delay of 3 minutes and 24 seconds. This underscores the borough's consistently busy streets and challenging road networks.
Southwark drivers face the fifth-highest delays in England. For a 10-mile trip, motorists can expect to spend an additional 31 minutes and 18 seconds in traffic on average. This corresponds to a delay of around 3 minutes and 8 seconds per mile, emphasizing the borough's heavy road usage and transport pressures.
Completing the Top Ten Congested Areas
Rounding out the top ten most congested areas for drivers are several other London boroughs, demonstrating the capital's widespread traffic challenges. Lambeth follows closely, where motorists face an average delay of 3 minutes and 3 seconds per mile, accumulating to approximately 30 minutes and 29 seconds of extra travel time on a typical 10-mile journey.
Kensington and Chelsea drivers experience 2 minutes and 55 seconds of delay per mile, equating to roughly 29 minutes and 10 seconds overall. In eighth position, Lewisham records average delays of 2 minutes and 50 seconds per mile, or around 28 minutes and 15 seconds for a 10-mile trip.
Both Haringey and Wandsworth share ninth position, with drivers in each borough facing 2 minutes and 45 seconds of delay per mile, resulting in 27 minutes and 30 seconds of additional travel time. Completing the top ten is Hammersmith and Fulham, where motorists experience an average delay of 2 minutes and 36 seconds per mile, equivalent to 26 minutes and 2 seconds lost to congestion on a 10-mile journey.
Regional Comparisons and Commuter Impact
The study reveals a striking geographical pattern, with Slough (13th) and Reading (16th) becoming the first locations outside London to appear in the rankings. This indicates how traffic congestion extends beyond the capital into nearby commuter towns, affecting those who travel into London for work.

Major regional cities demonstrate significantly shorter delays in comparison. Manchester (24th), Birmingham (34th) and Liverpool (37th) all experience average delays of less than 17 minutes for a 10-mile journey. This is substantially lower than London's figures, despite these cities' popularity and economic importance.
England's Least Congested Areas
At the opposite end of the spectrum, the least congested local authorities in England offer drivers considerably smoother journeys with minimal delays. Topping this list is Rutland, where motorists experience an average delay of just 12 seconds per mile, equating to only 1 minute and 58 seconds of additional travel time on a 10-mile journey.
Redcar and Cleveland follows with similarly light congestion, featuring delays of approximately 17 seconds per mile, or 2 minutes and 54 seconds overall. East Riding of Yorkshire ranks closely behind, with delays of 17 seconds per mile and a total of 2 minutes and 55 seconds across a 10-mile trip.
Telford and Wrekin places fourth, where the average delay per mile is 18 seconds, accumulating to 2 minutes and 56 seconds in total. North Lincolnshire takes fifth position, with delays of 21 seconds per mile, or 3 minutes and 28 seconds on a typical 10-mile journey.
Dorset and Shropshire share similarly low congestion levels, ranking sixth and seventh respectively. Drivers in both counties lose around 21 seconds per mile, translating to between 3 minutes and 31 seconds and 3 minutes and 32 seconds of delay over 10 miles.
Completing the top ten least congested areas are Central Bedfordshire, Hartlepool, and Halton. In these regions, motorists experience average delays of just 23 seconds per mile, equating to between 3 minutes and 48 seconds and 3 minutes and 51 seconds of total delay on a 10-mile trip.
Expert Commentary and Transport Implications
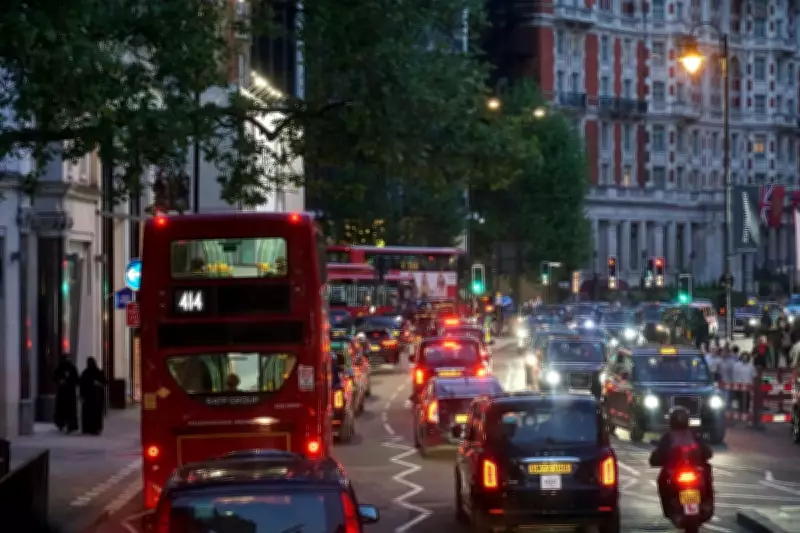
A spokesperson for The Bike Insurer commented on the significant findings: "The data reveals a clear divide between London boroughs and the rest of the country regarding time spent in traffic. While drivers in the City of London might endure nearly 45 minutes of delays on a 10-mile trip, motorists in Rutland face less than 2 minutes of delays for the same journey length."
"These substantial differences underscore why alternative transport methods like cycling are gaining popularity in congested urban areas. A cyclist can frequently complete a journey in less time than a car during peak hours, particularly in London where average traffic speeds can drop below 10 mph."
"As fuel costs and congestion continue to increase, many commuters are exploring alternatives to sitting in traffic. This shift isn't merely about saving time, but also about reducing stress, saving money, and making more environmentally sustainable transport choices."
The comprehensive study provides valuable insights into England's traffic landscape, highlighting the particular challenges faced by London boroughs while identifying areas where drivers enjoy relatively congestion-free journeys. The data serves as an important resource for transport planners, policymakers, and commuters seeking to understand and navigate the country's varied road networks.